Part One of a paid NEO Grantshares project, this advanced analytics dashboard combines allows the user to interactively select and utilize multiple linear regression and seasonal decomposition cycles in order to predict the price of NEO at month-end. See here for the full project scope and accompanying discussion.
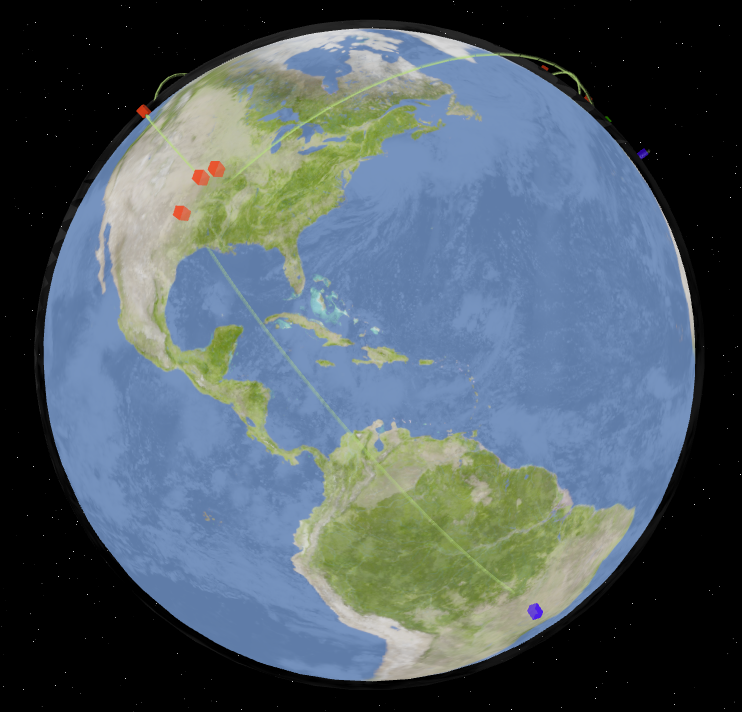
As part of a larger project for the NEO ecosystem, using React and ThreeJS, I built a 3D interactive map which shows NEO's current governance structure. See here for the accompanying Reddit post with discussion. Would suggest using desktop (with a mouse) to view it for now, as mobile still has a few issues to work out.
Are there long-term, hidden cycles and supercylces to the seemingly normal events we experience daily? I created a backend using the Python TSA stats package that can perform seasonal decomposition on NEO's, or any ticker's, price dataset. The front-end was created with React/MUI. This tool is critical for price forecasting. See the accompanying article and tool by clicking below.
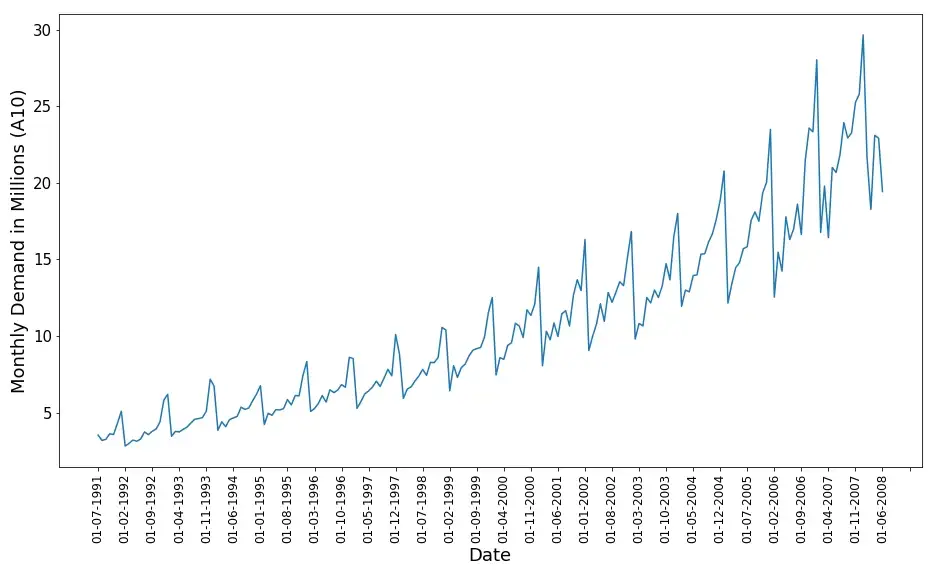
For the AWS API Hackathon, I created a scientific, real-time prediction engine that uses up-to-date supply and demand statistics, the latest costing models, and time series forecasting analysis to make superior oil price forecasts. It uses React/MUI/Plotly on the front-end and Python/AWS on the back-end, and is accessible to anyone on the web. For a more in-depth description on how it works and the tech behind it, feel free to check out this page.
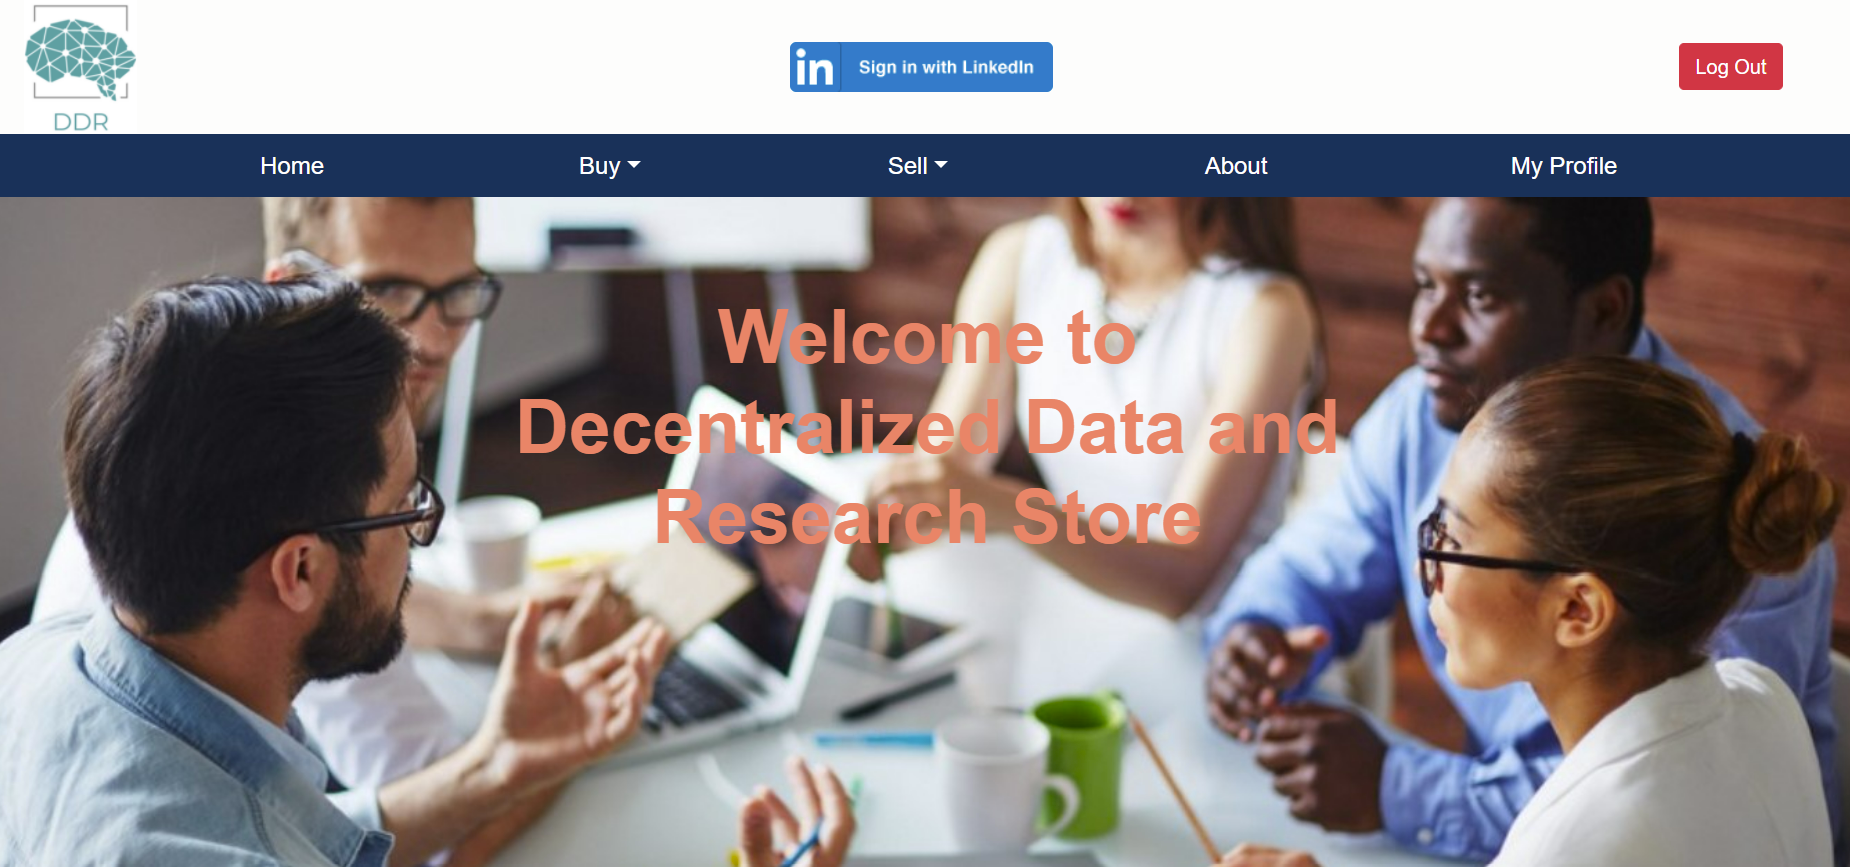
DDR (Decentralized Data and Research) is the first of its kind- a decentrazlied Amazon store for data and market intelligence. It was built using ReactJS/GraphQL/Auth0, with payments/escrow handled by the NEO ecosystem. It was the winner of a NEO Global Development incubation grant in spring of 2021.
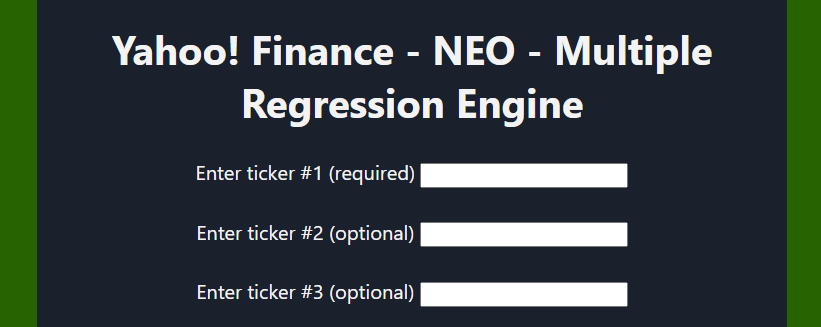
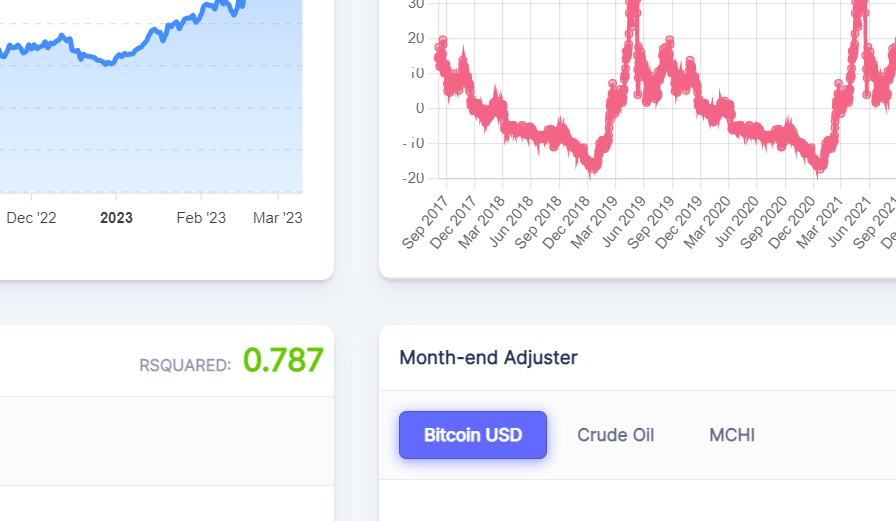
Using a React front-end and a Python (Scikit-Learn/Flask/AWS Lambda) back-end, I developed a Linear Multiple Regression Engine that allows the user to select up to 5 independent variables from Yahoo! Finance (stocks, commodities, cryptos, etc) and crunch out an R-squared value against a dependent variable of the user's choice. The R-squared value tells us the degree of correlation between variables and is a keystone of AI/ML. Note- as of 01/2023, Yahoo! Finance has implemented changes that prevent Pandas DataReader from working properly for the time being. Fix coming soon.

As part of a project I did for .bit, I created nearly 100 functions and 100+ Mocha/Chai tests which can be used to detect and classify all Digit patterns at godid.io. To accomplish this feat, I used
* Typescript, VanillaJS and RegEx to write detection functions for each of the Digit patterns (~100)
* TS-Mocha and Chai to write 100+ tests in order to ensure the accuracy of detection functions
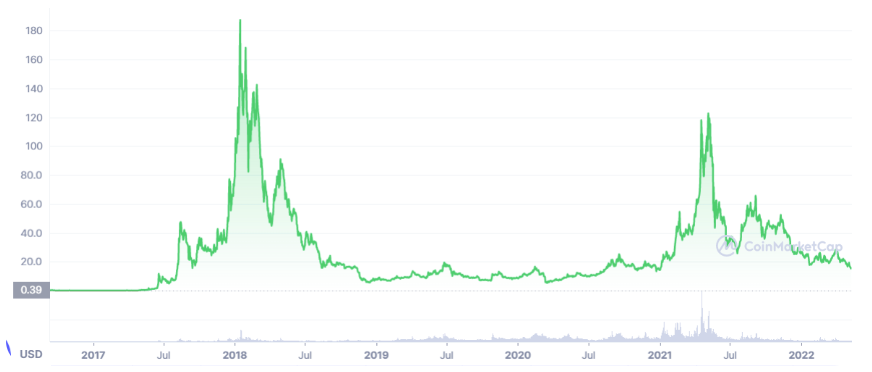
I utilized the Pandas library in Python as well as price data from Yahoo Finance to determine what factors are most responsible for changes in the price of NEO in the past year.

A Statement on Management Accounting I co-authored on how to improve forecasting. SMA's are considered IMA's most authoritative publication standard. The example in the appendix, how to use R to create a Bayesian Analysis useful for forecasting, was coded by me.
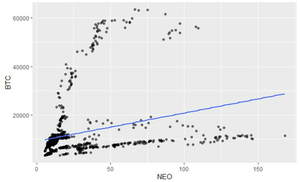
One of my favorite topics, I created a multi-variate regression analysis in R to forecast the price of NEO based on a basket of commodity and crypto prices. For this effort, I was selected 'member of the month' by the City of Zion developer committee.

From my research days, an article I co-authored on how the practice of management accounting can be used to analyze the Chinese EV industry. It was published in SF magazine.

From my consulting days- an article I co-authored to E&P Magazine using data to support how unconventional production could increase rapidly in China. The data, which took hundreds of hours to acquire and analyze, was used to successfully launch our China product.

A video recorded during NEO demo week for winning projects to introduce their apps to the community. DDR was one of two projects selected to kickoff NEO Demo Week.

From my grad school days, an article about my internship experience working with tea farmers in China's poorest region.